Getting Started Guide
Table of Contents
- Introduction
- What’s New
- Overview of the Online Calculator
- Using the Keyboard
- Setting Up Calculator Modes
- Error Conditions
1. Introduction
Welcome to ti84calc.net — a free, browser-based graphing calculator built for students, teachers, and professionals. No downloads, no installation, no login required. Simply open the website and start calculating.
This manual is designed to help you get the most out of the tool, from basic navigation to advanced mode configuration and error handling.
2. What’s New
Latest Updates
The online calculator now includes the following improvements and additions:
Calculator Core Updates
- Improved OS-level calculation engine for greater accuracy
- CellSheet support for spreadsheet-style data entry
- Language localization options for broader accessibility
MathPrint Implicit Multiplication with Negation
To reduce confusion, a multiplication symbol now automatically appears when negation is used in an expression.
- Example: Enter
3then(-)then2 - The display will show
3 * -2with a result of-6
Python App Support
- The Python App can be launched directly from the program menu
- Python programs can be saved and exported as
.pyfiles for editing in any text editor - Images can be converted and used within Python programs through the
ti_imagemodule
Data Collection Enhancements
- Collect multiple data samples in a single command
- Synchronize multiple outputs using compound statements
- RGB array support for controlling multiple outputs
- Sound function for playing repeated audio signals
- Range/time-of-flight measurement support
3. Overview of the Online Calculator
The online graphing calculator at ti84calc.net comes loaded with tools for performing pre-algebra, algebra, calculus, biology, chemistry, and physics calculations — all directly in your browser.
Key Features
High-Resolution Color Display
- Use color-coded equations and plots to distinguish between multiple graphs at a glance
- Add grid lines to make graphs easier to read and interpret
Familiar Graphing Calculator Interface
- Standard menu structure and navigation similar to widely-used graphing calculators
- MathPrint functionality to display math symbols, formulas, and stacked fractions exactly as they appear in textbooks
Image Support
- Import images in common formats (.gif, .jpg, .png, .tif, .bmp)
- Graph equations directly on top of images to connect math concepts to real-world scenarios
No Download Required
- Works on all devices — mobile, tablet, and desktop
- Accessible 24/7 with no login needed
Built-in Applications
The calculator includes a range of pre-loaded tools that extend its core functionality:
- Cabri Jr (geometry)
- Probability Simulations
- CellSheet (spreadsheet tool)
- Science Tools
- Conic Graphing
- Inequality Graphing
- Periodic Table
- Polynomial Root Finder
- Simultaneous Equation Solver
- Transformation Graphing
- Vernier EasyData support
4. Using the Keyboard
This section explains the on-screen keyboard, how to navigate the home screen, and how to use function keys effectively.
Turning the Calculator On
Press the ON button to launch the calculator. An information screen will appear on startup with the following options:
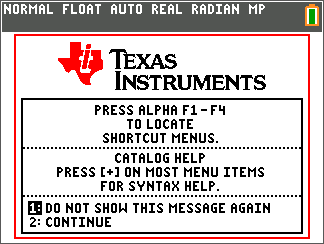
- Press 1 to go directly to the home screen and skip this screen on future visits
- Press 2 to continue to the home screen and keep the information screen active for future sessions
Note: Any key press from the information screen will take you to the home screen.
From the home screen, you can access shortcut menus using the alpha key in combination with function keys f1–f4. Pressing + on most menu items will open Catalog Help for that item.
Turning the Calculator Off
Press 2nd then OFF to power down the calculator.
- The Constant Memory feature saves all current settings and memory when the calculator is turned off
- If the calculator is connected to another device, that connection will automatically wake it
Automatic Power Down (APD)
To preserve battery life (on physical devices) and system resources, the calculator will automatically power off after approximately three to four minutes of inactivity. When it powers back on, your display, cursor position, and any active error conditions are fully restored.
Keyboard Layout
The calculator keyboard is organized into six functional groups:
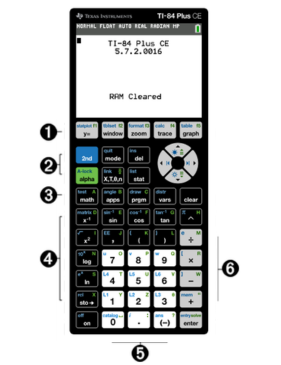
| Section | Purpose |
|---|---|
| 1. Graph/Plot Setup Keys | Access interactive graphing and plotting features |
| 2. Editing Keys | Edit expressions, values, and insert MathPrint fraction templates |
| 3. Math and Statistics Keys | Open menus for math, statistics, and basic functions |
| 4. Scientific Keys | Access scientific calculator capabilities including trigonometric functions |
| 5. Number Keys | Enter numeric values |
| 6. Common Math Functions | Perform division, multiplication, subtraction, and addition |
Function Keys Explained
The calculator keyboard uses three levels of key functions:
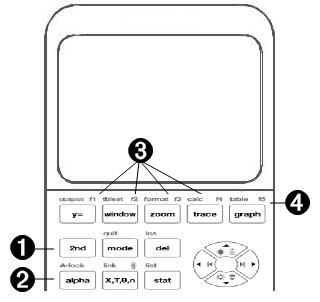
| Key | Function |
|---|---|
| 2nd | Activates the secondary function printed above and to the left of each key |
| alpha | Activates the tertiary function printed above and to the right of each key |
| alpha + f1–f4 | Opens shortcut menus for fractions, matrices, MATH, and VARS |
| alpha + f5 | Opens a context-sensitive shortcut menu for interactive features |
Primary Function The label printed directly on the key. For example, press math to open the MATH menu.
Secondary Function Press 2nd first, then the target key. The cursor changes to an upward arrow (↑) to indicate 2nd mode is active. For example, press 2nd + test to open the TEST menu.
Tertiary (Alpha) Function Press alpha first, then the target key. The cursor changes to the letter A to indicate alpha mode is active. For example, press alpha + A to type the letter A.
To lock the alpha key and enter multiple letters without pressing alpha each time, press 2nd then A-lock. Press alpha again to unlock it.
Display Brightness
Adjusting Brightness
You can adjust the screen brightness to suit your environment:
- Press 2nd + ↓ to darken the screen one level at a time
- Press 2nd + ↑ to lighten the screen one level at a time
The brightness setting is saved automatically and retained the next time you open the calculator.
Automatic Dimming
The display will automatically dim after 90 seconds of inactivity. Press ON to restore the screen to its previous brightness level without affecting any of your work.
5. Setting Up Calculator Modes
Opening the Mode Screen
Press mode to open the mode settings screen. By default, the cursor will be positioned on NORMAL. Press ↑ to toggle between MathPrint and Classic display modes.
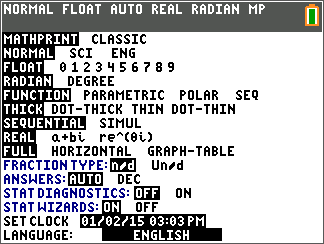
All mode settings are automatically saved by the Constant Memory feature and retained when the calculator is powered off.
Changing Mode Settings
To update any mode setting, follow these steps:
- Press ↓ or ↑ to move the cursor to the row you want to change
- Press → or ← to move across the row to your desired setting
- Press enter to confirm and apply the setting
Exception — Language Setting: Use → or ← to highlight a language, then press ↓ or ↑ to confirm it.
Note: The second line of the status bar displays context help with a brief description of the currently highlighted mode.
Mode Reference Table
| Mode | Options | Description |
|---|---|---|
| Display Style | MATHPRINT / CLASSIC | Controls whether inputs and outputs appear in textbook format or standard calculator format |
| Numeric Notation | NORMAL / SCI / ENG | Sets the number display format (standard, scientific, or engineering notation) |
| Decimal Places | FLOAT / 0–9 | Sets the number of decimal places shown in answers |
| Angle Unit | RADIAN / DEGREE | Sets the unit used for angle measurement |
| Graph Type | FUNCTION / PARAMETRIC / POLAR / SEQ | Selects the type of graphing |
| Line Style | THICK / DOT-THICK / THIN / DOT-THIN | Resets all Y= graph line styles |
| Plot Order | SEQUENTIAL / SIMUL | Controls whether functions are plotted one at a time or simultaneously |
| Number Type | REAL / a+bi / re^(θi) | Sets real, rectangular complex, or polar complex number format |
| Screen Layout | FULL / HORIZONTAL / GRAPH-TABLE | Switches between full screen and split-screen modes |
| Fraction Display | n/d / Un/d | Displays results as simple or mixed fractions |
| Answer Format | AUTO / DEC | Controls whether answers appear in exact or decimal form |
| Stat Diagnostics | OFF / ON | Toggles additional diagnostic info in statistical regression results |
| Stat Wizards | ON / OFF | Toggles syntax help prompts for statistical and distribution commands |
| Clock | SET CLOCK | Allows you to set the current date and time |
| Language | ENGLISH (and others) | Sets the display language |
6. Error Conditions
The calculator automatically detects errors during the following operations:
- Evaluating an expression
- Executing an instruction
- Plotting a graph
- Storing a value
Diagnosing an Error
When an error is detected, the calculator displays an error screen with a short description of the problem. Two options are presented:
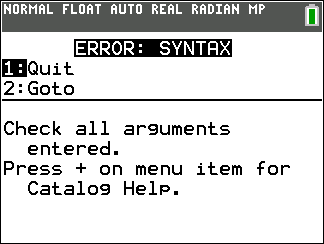
| Option | Action |
|---|---|
| 1: Quit | Returns to the home screen |
| 2: Goto | Returns to the previous screen with the cursor positioned at or near the location of the error |
Note: If a syntax error occurs inside a Y= function while a program is running, selecting 2: Goto will take you to the Y= editor rather than back to the program.
Correcting an Error
To resolve an error, follow these steps:
- Note the error type shown on screen (displayed as ERROR: error type)
- Select 2: Goto if available — this takes you back to the location of the error
- Review the expression carefully. Error messages provide hints but may not fully describe the issue
- Correct the expression and press enter to re-evaluate
For questions or feedback, visit the Contact page on ti84calc.net.